Introduction to Reporting
Groundhogg's reporting dashboard provides incredible insight into how your list is interacting with your information and consuming your content.
All available reports allow you to refine your data by utilizing the date range selector to focus on a specific time.
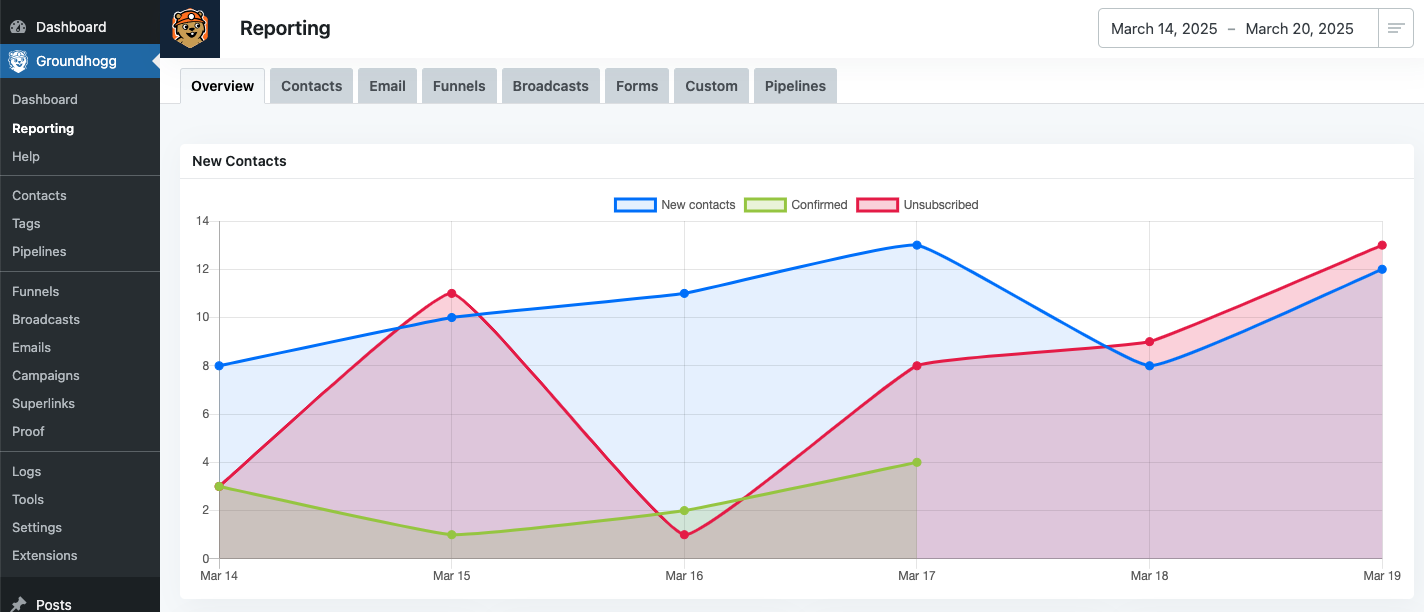
New Contacts Graph
The report is structured as a line graph with three data series( New Contacts (Blue Line), Confirmed Contacts (Green Line), Unsubscribed Contacts (Red Line) ), each representing a different contact metric over the specified date range.
New Contacts (Blue Line)
- Definition: This metric tracks the number of new contacts added to the Groundhogg database each day, represented by a blue line with a light blue area fill.
Confirmed Contacts (Green Line)
- Definition: This metric tracks the number of contacts who confirmed their email addresses each day (e.g., by clicking a confirmation link in a double opt-in email), represented by a green line with a light green area fill.
Unsubscribed Contacts (Red Line)
- Definition: This metric tracks the number of contacts who unsubscribed from the email list each day, represented by a red line with a light red area fill.
Quick Contact Stats
This table provides a high-level overview of contact activity through four key metrics: New Contacts, Confirmed Contacts, Engaged Contacts, and Unsubscribed Contacts. Each metric is displayed in a rectangular block with a numerical value and a percentage change compared to the previous 7 days, offering users a quick snapshot of their contact list’s growth, engagement, and retention.

New Contacts
- Definition: This metric shows the total number of new contacts added to the Groundhogg database during the reporting period.
- Example Data: 62 new contacts, with a 28% decrease compared to the previous 7 days.
- Lead Generation Monitoring: Groundhogg users can track the growth of their contact list, which reflects the effectiveness of their lead generation strategies (e.g., opt-in forms, landing pages, or ad campaigns). A 28% decrease suggests that fewer new contacts were added compared to the previous period, prompting further investigation.
- Campaign Adjustment: The decline in new contacts indicates a potential issue with lead generation efforts, such as a less effective campaign or reduced website traffic. Users can use this insight to optimize their lead capture methods, such as improving form placement or running a new promotion to boost sign-ups.
Confirmed Contacts
- Definition: This metric tracks the number of contacts who confirmed their email addresses during the reporting period (e.g., by clicking a confirmation link in a double opt-in email).
- Example Data: 10 confirmed contacts, with a 67% decrease compared to the previous 7 days.
- Engagement Validation: Confirmed contacts indicate that new sign-ups are actively engaging by verifying their email addresses, which is crucial for maintaining a high-quality, engaged contact list. The 67% decrease suggests a significant drop in confirmations, which could impact the number of actionable contacts.
- List Quality Improvement: The sharp decline in confirmed contacts prompts users to review their double opt-in process. They can simplify the confirmation email, ensure the confirmation link is working, or offer an incentive for confirming, ensuring a higher percentage of new contacts become confirmed and ready for marketing campaigns.
Engaged Contacts
- Definition: This metric represents the number of contacts who have recently interacted with the user’s campaigns (e.g., opened an email, clicked a link, or submitted a form) during the reporting period.
- Example Data: 596 engaged contacts, with a 130% increase compared to the previous 7 days.
- Engagement Tracking: A 130% increase in engaged contacts (596) indicates a significant improvement in audience interaction, suggesting that recent campaigns, emails, or funnels are resonating well with contacts. This aligns with the high open rate (40%) seen in the related Email Performance Report.
- Segmentation Opportunities: A large number of engaged contacts provides users with a valuable pool for segmentation. They can target these contacts with more personalized campaigns, such as upselling to engaged customers or asking for feedback, to further increase conversions.
Unsubscribed Contacts
- Definition: This metric tracks the number of contacts who unsubscribed from the email list during the reporting period.
- Example Data: 45 unsubscribed contacts, with a 29% increase compared to the previous 7 days.
- Retention Monitoring: The 29% increase in unsubscribes (45) indicates a growing number of contacts opting out, which could signal issues with email content, frequency, or relevance. This aligns with the rising unsubscribe trend seen in the New Contacts graph (e.g., 12 unsubscribes on March 20).
- Content Optimization: The increase in unsubscribes prompts users to investigate the cause (e.g., an email sent during the period might have been poorly received) and adjust their email strategy. They can reduce email frequency, improve content relevance, or segment their audience more effectively to prevent further unsubscribes.
Quick Email Stats

Emails Sent
- Definition: This metric shows the total number of emails sent across all funnels and broadcasts during the reporting period.
- Example Data: 3,106 emails sent, with a 148% increase compared to the previous 7 days.
- Campaign Activity Monitoring: Groundhogg users can track the volume of emails being sent, which reflects the activity level of their funnels and broadcasts. A 148% increase indicates a significant uptick in email activity, possibly due to a new campaign, increased funnel activity, or a larger contact list.
- Resource Allocation: Understanding email volume helps users ensure they’re not overwhelming their audience with too many emails or missing opportunities by sending too few. They can adjust their funnel or broadcast settings in Groundhogg to align with their marketing goals, ensuring optimal engagement without risking unsubscribes.
Open Rate
- Definition: This metric represents the percentage of sent emails that were opened by recipients, calculated as (Number of Opens ÷ Emails Sent × 100).
- Example Data: 40% open rate, with no change (0%) compared to the previous 7 days.
- Engagement Insight: A 40% open rate is strong (industry averages typically range from 15-25%), indicating that the emails are consistently capturing attention. The 0% change suggests that this high open rate has been maintained, reflecting stable performance in subject lines, sender reputation, or timing.
- Consistency Validation: The stable open rate provides users with confidence in their email strategy, allowing them to focus on other areas (e.g., improving click-thru rates) while maintaining effective subject lines or send times. Users can also use Groundhogg’s A/B testing features to experiment with subject lines to potentially increase this rate further.
Click Thru Rate
- Definition: This metric calculates the percentage of recipients who clicked on a link within the email, calculated as (Number of Clicks ÷ Emails Sent × 100).
- Example Data: 22% click-thru rate, with a 16% increase compared to the previous 7 days.
- Action Tracking: A 22% click-thru rate is impressive (industry averages often range from 2-5%), and the 16% increase indicates improved engagement with email content. This suggests that recent changes to email content, calls-to-action, or link placement are driving more clicks.
- Content Improvement: The increase in click-thru rate encourages users to continue optimizing their email content. They can use Groundhogg’s email editor to further enhance calls-to-action, test different link placements, or add more compelling offers to sustain or improve this upward trend.
Top Funnel Stats
The top funnel stats section is divided into two sections: Top Converting Funnels, which lists funnels with their conversion rates, and Top Performing Funnel Emails, which details the performance of individual emails within funnels. This report helps users identify their most effective funnels and emails, enabling them to optimize their marketing strategies for better engagement and conversions.

Top Converting Funnels*
- Funnel: The name of the funnel. Clicking on the funnel name directs users to the specific funnel report for detailed insights.
- Conversions: The conversion rate is expressed as a percentage, with the raw number of conversions shown in parentheses. Clicking on the percentage links to a filtered view of the contacts within the funnel who completed the conversion.
Top Performing Funnel Emails*
- Emails: The name of the email with the funnel name in brackets.
- Sent: The number of times the email was sent.
- Opens: The percentage of sent emails that were opened, with the raw number of opens in parentheses.
- Clicks: The percentage of sent emails that resulted in a click, with the raw number of clicks in parentheses.
- Unsubs: The number of contacts who unsubscribed after receiving the email, with the raw number of unsubscribers in parentheses.
*Sortable
Top Countries, Lead Sources
This report is divided into two sections: Top Countries, which lists the countries with the most contacts, and Top Lead Sources, which details the sources (e.g., websites or referral URLs) that generated the most leads. This report helps users understand where their audience is located and which channels are most effective at driving new contacts, enabling them to optimize their marketing strategies for better targeting and lead generation.

Top Countries
This section lists the countries with the highest number of contacts, showing the geographic distribution of the user’s audience.
Top Lead Sources
This section lists the top sources (e.g., websites or referral URLs) that generated new contacts, detailing the effectiveness of lead acquisition channels.
Reporting Period
Reports be filtered by Last 30 days, This month, Last month, Last 7 days, Last 3 months or This year.

Reports can be sorted by date range. Click on the start or end dates and a calendar will pop up.
