Email Reporting
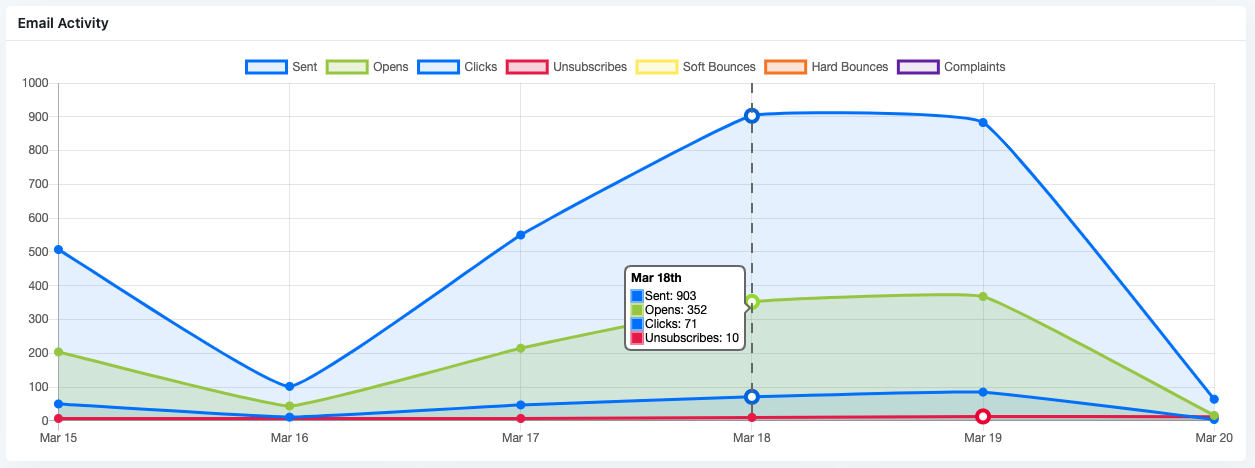
Upon selecting the " Email" tab a report specifically for Emails is presented with charts and tables. You can refine your data by utilizing the date range selector to focus on a specific time period thereby narrowing the results for more targeted analysis. The first is a line graph of "Email Activity" for the last 30 days, displaying Emails Sent, Opens, Clicks, Unsubscribes, Soft Bounces, Hard Bounces, and Complaints. Hover over any point on the graph to view the total counts for that day. To customize your view, click the colored boxes to toggle different graph options on or off.
Email Activity Graph
The report is structured as a line graph with seven data series each representing a different contact metric over the specified date range.
Quick Email Stats

Emails Sent
- Definition: This metric shows the total number of emails sent across all funnels and broadcasts during the reporting period.
- Example Data: 3,106 emails were sent, with a 148% increase compared to the previous 7 days.
- Campaign Activity Monitoring: Groundhogg users can track the volume of emails being sent, which reflects the activity level of their funnels and broadcasts. A 148% increase indicates a significant uptick in email activity, possibly due to a new campaign, increased funnel activity, or a larger contact list.
- Resource Allocation: Understanding email volume helps users ensure they’re not overwhelming their audience with too many emails or missing opportunities by sending too few. They can adjust their funnel or broadcast settings in Groundhogg to align with their marketing goals, ensuring optimal engagement without risking unsubscribes.
Open Rate
- Definition: This metric represents the percentage of sent emails that were opened by recipients, calculated as (Number of Opens ÷ Emails Sent × 100).
- Example Data: 40% open rate, with no change (0%) compared to the previous 7 days.
- Engagement Insight: A 40% open rate is strong (industry averages typically range from 15-25%), indicating that the emails are consistently capturing attention. The 0% change suggests that this high open rate has been maintained, reflecting stable performance in subject lines, sender reputation, or timing.
- Consistency Validation: The stable open rate provides users with confidence in their email strategy, allowing them to focus on other areas (e.g., improving click-thru rates) while maintaining effective subject lines or send times. Users can also use Groundhogg’s A/B testing features to experiment with subject lines to potentially increase this rate further.
Click Thru Rate
- Definition: This metric calculates the percentage of recipients who clicked on a link within the email, calculated as (Number of Clicks ÷ Emails Sent × 100).
- Example Data: 22% click-thru rate, with a 16% increase compared to the previous 7 days.
- Action Tracking: A 22% click-thru rate is impressive (industry averages often range from 2-5%), and the 16% increase indicates improved engagement with email content. This suggests that recent changes to email content, calls-to-action, or link placement are driving more clicks.
- Content Improvement: The increase in click-thru rate encourages users to continue optimizing their email content. They can use Groundhogg’s email editor to further enhance calls-to-action, test different link placements, or add more compelling offers to sustain or improve this upward trend.

Unsubscribes
- Definition: This metric shows the total number of contacts who have unsubscribed from the email list during the reporting period.
- Example Data: 42 unsubscribes, with a 31% increase compared to the previous 7 days.
- Retention Monitoring: Groundhogg users can track the number of unsubscribes to assess audience retention. The 31% increase (42 unsubscribes) aligns with the Contact Summary Metrics Report (45 unsubscribes, a 29% increase), indicating a growing trend of contacts opting out, which may be linked to the high email volume (3,106 emails sent, a 148% increase) seen in the Email Performance Summary Report.
- Content and Frequency Optimization: The increase in unsubscribes suggests potential audience fatigue or dissatisfaction with email content. Users can reduce email frequency, segment their audience for more relevant content, or review recent emails (e.g., those sent on March 18 and 19, as seen in the Email Activity Report, where unsubscribes peaked at 12) to identify and address issues like irrelevant content or overly frequent sends.
Spam
- Definition: This metric represents the number of emails marked as spam by recipients, though in Groundhogg, this may also reflect a broader spam score or deliverability issue if direct spam complaints aren’t tracked.
- Example Data: 0 spam, with a 0% change compared to the previous 7 days.
- Spam Risk Assessment: A value of 0 indicates that no emails were marked as spam (or no spam issues were detected), suggesting good email practices and a strong sender reputation.
- Confidence in Email Practices: The 0% change reinforces that the user’s email campaigns are not triggering spam filters or complaints, allowing them to continue their current email strategy with confidence. Users can maintain this by ensuring compliance with email marketing best practices, such as using double opt-in and avoiding spammy language in subject lines.
Bounces
- Definition: This metric shows the total number of emails that failed to deliver, combining both soft bounces (temporary failures, e.g., a full inbox) and hard bounces (permanent failures, e.g., an invalid email address).
- Example Data: 0 bounces, with a 0% change compared to the previous 7 days.
- Deliverability Monitoring: A value of 0 bounces, consistent with the Email Activity Report (near-zero soft and hard bounces from March 15 to March 20), indicates excellent email deliverability and a clean email list with valid addresses.
- List Health Maintenance: The 0% change suggests that the user’s list hygiene practices (e.g., removing invalid emails, using double opt-in) are effective. Users can maintain this by regularly cleaning their list, such as removing unengaged contacts or those who haven’t confirmed their emails, to prevent future bounces.
Complaints
- Definition: This metric represents the number of recipients who marked the email as spam or filed a complaint, typically reported through feedback loops with email service providers.
- Example Data: 0 complaints, with a 0% change compared to the previous 7 days.
- Sender Reputation Insight: A value of 0 complaints, consistent with the Email Activity Report (near-zero complaints from March 15 to March 20), indicates that recipients are not marking emails as spam, reflecting a strong sender reputation and relevant content.
- Reassurance for Email Strategy: The 0% change confirms that the user’s email campaigns are well-received, allowing them to continue their current strategy without fear of damaging their sender reputation. Users can sustain this by ensuring emails are relevant, using clear unsubscribe options, and avoiding practices that might trigger complaints, such as misleading subject lines.
Last Broadcast
The Last Broadcast Report is divided into two main parts: a donut chart visualizing email engagement and a summary section with detailed metrics.The chart shows the proportion of contacts who interacted with the email broadcast in three categories: Clicked, Opened, and Unopened. The summary provides detailed metrics about the email broadcast, including the subject, date, and performance statistics.

The Chart Categories:
- Clicked (Orange): Contacts who clicked on a link within the email.
- Opened (Blue): Contacts who opened the email but did not click on any links.
- Unopened (Green): Contacts who did not open the email.
Example Data:
- Unopened: 244 contacts (61.62%)
- Opened: 152 contacts (38%)
- Clicked: 28 contacts (18% of those who opened, or 7% of the total sent)
User Benefits:
- Engagement Visualization: The donut chart provides a clear visual representation of how contacts interacted with the email. The large unopened segment (61.62%, 244 contacts) indicates that a majority of recipients did not engage with the email, while the 38% open rate (152 contacts) and 18% click rate (28 contacts) show moderate engagement among those who did.
- Subject Line Effectiveness Insight: The 38% open rate suggests that the subject line ("Know how your business is performing at ALL times!") was moderately effective but could be improved to increase opens. Users can A/B test different subject lines in future broadcasts to boost the open rate.
- Call-to-Action (CTA) Effectiveness Insight: The 18% click rate (28 contacts) among those who opened the email indicates that the email’s content and CTAs were engaging for a subset of recipients. Users can analyze the email’s content to identify what drove clicks (e.g., a specific offer or link placement) and replicate it in future emails.
Metrics:
- Subject: The subject line of the email ("Know how your business is performing at ALL times!").
- Date: The date and time the email was sent (March 19, 2025, 10:00 am).
- Sent: The total number of emails sent (396).
- Opens: The percentage and number of emails opened (38%, 152 contacts).
- Clicks: The percentage and number of contacts who clicked on a link (18%, 28 contacts).
- Unopened: The number and percentage of contacts who did not open the email (244, 61.62%).
- Unsubscribed: The percentage and number of contacts who unsubscribed after receiving the email (1%, 4 contacts).
User Benefit:
- Performance Overview: The summary metrics provide a quick snapshot of the email’s performance. The 396 emails sent align with the high email volume on March 19 (850 emails sent) seen in the Email Activity Report, indicating this broadcast was part of a larger email effort on that day.
- Engagement Analysis: The 38% open rate (152 contacts) and 18% click rate (28 contacts) are consistent with the Email Activity Report’s data for March 19 (300 opens, 100 clicks across all emails), suggesting this broadcast contributed significantly to the day’s engagement. Users can use Groundhogg’s email editor to replicate the elements that drove this engagement in future broadcasts.
- Retention Monitoring: The 1% unsubscribe rate (4 contacts) is relatively low but contributes to the 12 unsubscribes on March 19 seen in the Email Activity Report. Users can cross-reference with the Email Retention and Deliverability Metrics Report (42 unsubscribes, a 31% increase) to assess if this broadcast’s content or frequency contributed to the overall unsubscribe trend, and adjust accordingly (e.g., by reducing email frequency or improving content relevance).
- Timing Insight: The broadcast was sent at 10:00 am on March 19, a day with high engagement (300 opens, 100 clicks). Users can note this timing as effective and schedule future broadcasts around this time to maximize engagement.
Top Performing Broadcasts
This report is presented as a table listing the top email broadcasts, with columns for Funnel, Sent, Opens, Clicks, and Unsubs (Unsubscribes). Each column is sortable, as indicated by the up/down arrows next to the column headers, allowing users to rank emails by different metrics. The report helps users identify their most effective email broadcasts, enabling them to replicate successful strategies and optimize future campaigns for better engagement and retention.
 The table has the following sortable columns:
- Funnel: The name of the email broadcast. Clicking on the funnel name links to the Broadcast report.
- Sent: The total number of emails sent for that broadcast. Clicking the number links to a filtered list of Contacts(Received Broadcast).
- Opens: The percentage and number of emails opened. Clicking the number links to a filtered list of Contacts(Opened Broadcast).
- Clicks: The percentage and number of contacts who clicked on a link within the email. Clicking the number links to a filtered list of Contacts(Broadcast Link Clicked).
- Unsubs: The percentage and number of contacts who unsubscribed after receiving the email. Clicking the number links to a filtered list of Contacts(Unsubscribed).
Identifying High-Performing Emails:
- Benefit: The table highlights the top-performing email broadcasts based on engagement metrics like opens and clicks. For example, the "Reports Tour" email with 410 sent emails achieved a 45% open rate (183 opens) and a 28% click rate (51 clicks), making it the top performer in terms of engagement.
- Actionable Insight: Users can analyze the content, subject line, or timing of high-performing emails like the "Reports Tour" (45% opens, 28% clicks) to identify what drove engagement (e.g., a compelling subject line or strong call-to-action) and replicate these elements in future broadcasts.
Engagement Analysis:
- Benefit: The Opens and Clicks columns provide detailed engagement metrics. The "Reports Tour" email with 410 sent emails has the highest open rate (45%, 183 opens) and click rate (28%, 51 clicks), while the "Funnel Builder Tour" email with 416 sent emails has a lower open rate (35%, 144 opens) but a decent click rate (16%, 28 clicks).
- Actionable Insight: Users can use Groundhogg’s email editor to replicate the elements of high-engagement emails, such as the "Reports Tour" email’s subject line or content, in future campaigns. For emails with lower engagement, like the "Funnel Builder Tour" (35% opens), users can A/B test new subject lines or content to improve performance.
Retention Monitoring:
- Benefit: The Unsubs column helps users monitor retention by showing the unsubscribe rate for each email. The "Reports Tour" email with 410 sent emails has a 2% unsubscribe rate (9 unsubscribes), which is the highest in the report, while the "Email Editor Tour" email with 218 sent emails has a 0% unsubscribe rate (1 unsubscribe).
- Actionable Insight: The higher unsubscribe rate for the "Reports Tour" email (2%, 9 unsubscribes) contributes to the overall unsubscribe trend (42 total, a 31% increase, as seen in the Email Retention and Deliverability Metrics Report). Users can review this email’s content or frequency to identify potential issues (e.g., irrelevant content or audience fatigue) and adjust future emails to reduce unsubscribes. The low unsubscribe rate for the "Email Editor Tour" (0%, 1 unsubscribe) suggests that its content was well-received, providing a model for future emails.
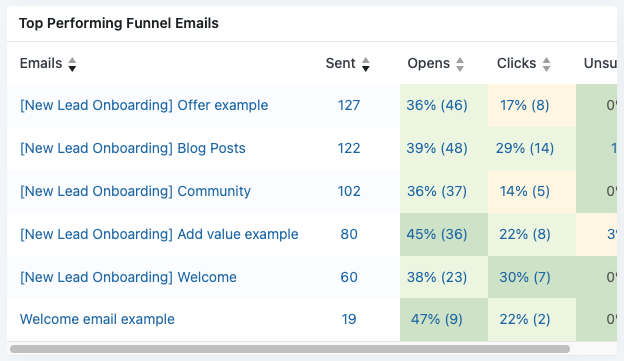
Top Performing Funnel Emails
This report is presented as a table listing the top-performing funnel emails, with columns for Emails, Sent, Opens, Clicks, and Unsubs (Unsubscribes). The report helps users identify their most effective funnel emails, enabling them to replicate successful strategies and optimize their automated funnels for better engagement and retention.
The table has the following sortable columns:
- Emails: The name of the email within the funnel. Clicking on the email name links to the funnel report.
- Sent: The total number of emails sent for that funnel email.
- Opens: The percentage and number of emails opened.
- Clicks: The percentage and number of contacts who clicked on a link within the email.
- Unsubs: The percentage and number of contacts who unsubscribed after receiving the email.
- Benefit: The table highlights the top-performing emails within automated funnels based on engagement metrics like opens and clicks. For example, the "[New Lead Onboarding] Blog Posts" email has a strong click rate (29%, 14 clicks), and the "Welcome email example" has the highest open rate (47%, 9 opens), despite being sent to fewer contacts (19).
- Actionable Insight: Users can analyze the content, subject line, or structure of high-performing emails like "[New Lead Onboarding] Blog Posts" (29% clicks) and "Welcome email example" (47% opens) to identify what drove engagement (e.g., a compelling subject line, relevant content, or strong call-to-action) and replicate these elements in other funnel emails.
- Benefit: The Opens and Clicks columns provide detailed engagement metrics. The "Welcome email example" has the highest open rate (47%, 9 opens), while the "[New Lead Onboarding] Welcome" email has the highest click rate (30%, 7 clicks). These rates are competitive with the 38%-45% open rates and 16%-28% click rates seen in the Top Performing Broadcast Emails Report.
- Actionable Insight: Users can use Groundhogg’s email editor to replicate the elements of high-engagement emails in other parts of their funnels. For example, the subject line of the "Welcome email example" (47% opens) could be used as a model for other welcome emails, and the content or call-to-action in the "[New Lead Onboarding] Welcome" email (30% clicks) could be applied to other emails to boost click rates.
- Benefit: The Unsubs column helps users monitor retention by showing the unsubscribe rate for each email. Most emails have a 0% unsubscribe rate, except for "[New Lead Onboarding] Blog Posts" (1%) and "[New Lead Onboarding] Add value example" (3%), which contribute to the overall unsubscribe trend (42 total, a 31% increase, as seen in the Email Retention and Deliverability Metrics Report).
- Actionable Insight: The 3% unsubscribe rate for "[New Lead Onboarding] Add value example" (80 sent, 3 unsubscribes) is the highest in the report and warrants investigation. Users can review this email’s content or timing to identify potential issues (e.g., irrelevant content or audience fatigue) and adjust future emails to reduce unsubscribes. The 0% unsubscribe rates for most emails suggest that these emails are well-received, providing a model for maintaining retention.
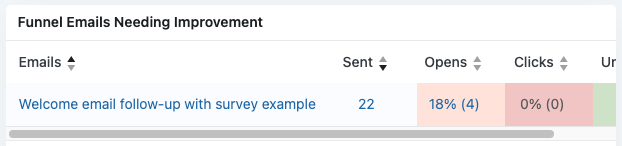
Funnel Emails Needing Improvements
This report is presented as a table listing funnel emails that need improvement, with columns for Emails, Sent, Opens, Clicks, and Unsubscribes. The report helps users identify poorly performing funnel emails, enabling them to take targeted actions to improve engagement and overall funnel effectiveness.
The table has the following sortable columns:
- Emails: The name of the email within the funnel. Clicking on the email name links to the funnel report.
- Sent: The total number of emails sent for that funnel email. Clicking the number links to a filtered list of Contacts(Email Received).
- Opens: The percentage and number of emails opened. This column is highlighted in pink to indicate poor performance. Clicking the number links to a filtered list of Contacts(Email Opened).
- Clicks: The percentage and number of contacts who clicked on a link within the email. This column is highlighted in red to indicate critical underperformance. Clicking the number links to a filtered list of Contacts(Email Link Clicked).
- Unsubs: The percentage and number of contacts who unsubscribed after receiving the email. This column is highlighted in green to indicate good performance (low unsubscribe rate). Clicking the number links to a filtered list of Contacts(Unsubscribed).
- Benefit: The table highlights funnel emails that are underperforming based on engagement metrics. The "Welcome email follow-up with survey example" has a low open rate (18%, 4 opens) and a 0% click rate (0 clicks), indicating significant room for improvement.
- Actionable Insight: Users can prioritize this email for optimization, focusing on improving the subject line to increase opens and revising the content or call-to-action (CTA) to encourage clicks. For example, they might test a more compelling subject line or add a stronger incentive for completing the survey.
- Benefit: The Opens and Clicks columns provide detailed engagement metrics, with color-coded highlights to draw attention to poor performance. The 18% open rate (4 opens) is highlighted in pink, indicating it’s below an acceptable threshold (e.g., compared to the 38%-45% open rates in the Top Performing Broadcast Emails Report), and the 0% click rate (0 clicks) is highlighted in red, showing a critical lack of engagement.
- Actionable Insight: The low open rate suggests the subject line may not be engaging enough. Users can use Groundhogg’s email editor to A/B test new subject lines, such as making them more specific or urgent (e.g., "We’d Love Your Feedback – Take Our Quick Survey!"). The 0% click rate indicates the email’s content or CTA isn’t compelling. Users can revise the email to include a clearer CTA, such as a prominent button linking to the survey, or offer an incentive (e.g., a discount for completing the survey) to encourage clicks.
- Benefit: The Unsubs column helps users monitor retention, with a green highlight indicating a low unsubscribe rate. While the exact unsubscribe rate isn’t specified, the green highlight suggests it’s minimal (possibly 0%), which is a positive sign compared to the overall unsubscribe trend (42 total, a 31% increase, as seen in the Email Retention and Deliverability Metrics Report).
- Actionable Insight: The low unsubscribe rate indicates that the email isn’t causing significant audience dissatisfaction, despite its poor engagement. Users can focus on improving engagement without worrying about immediate retention issues, but they should still monitor this metric in future reports to ensure it remains low after making changes to the email.