Funnel Reporting

You can also get to the reporting view for the funnel by clicking three dot ellipse and selecting Reports.

Or by clicking the Report link from the list view.

Quick Contact Stats
Next on the page are the funnel quick stats, these provide insight into funnel trends, like the number of active contacts within the reporting time range

Contacts Added
- Definition: This metric shows the number of new contacts added to the funnel during the reporting period.
- Example Data: 53 contacts added, with a 1,225% increase compared to the previous 7 days.
- Lead Generation Insight: Groundhogg users can gauge the effectiveness of their lead generation strategies, such as opt-in forms, landing pages, or ad campaigns. A high increase (like 1,225%) indicates a successful campaign or promotion that attracted a large number of new leads.
- Actionable Growth: Users can identify which strategies are driving sign-ups and replicate or scale them to grow their contact list further.
Active Contacts
- Definition: This metric represents the number of contacts who are actively engaging with the funnel, such as opening emails, clicking links, or interacting with campaigns.
- Example Data: 55 active contacts, with a 511% increase compared to the previous 7 days.
- Engagement Tracking: Groundhogg users can assess how well their email sequences, broadcasts, or automated workflows are keeping contacts engaged. A 511% increase suggests that the funnel is successfully maintaining contact interest.
- Segmentation Opportunities: Knowing which contacts are active allows users to segment their audience for more targeted campaigns, improving relevance and potentially boosting conversions.
Conversions
- Definition: This metric tracks the number of contacts who completed the desired action in the funnel, such as making a purchase, booking a call, or upgrading to a paid plan.
- Example Data: 1 conversion, with a 50% decrease compared to the previous 7 days.
- Goal Achievement Monitoring: Groundhogg users can directly measure the success of their funnel in achieving its primary goal. A drop in conversions (like 50%) signals a potential issue that needs attention.
- Optimization Focus: A decline in conversions prompts users to investigate and optimize their funnel steps, such as improving the call-to-action, streamlining the checkout process, or addressing objections through follow-up emails.
Conversion Rate
- Definition: This metric calculates the percentage of contacts who converted out of the total active contacts in the funnel (Conversions ÷ Active Contacts × 100).
- Example Data: 2% conversion rate, with a 91% decrease compared to the previous 7 days.
- Efficiency Evaluation: The conversion rate helps Groundhogg users understand how effectively their funnel turns active contacts into customers. A low or declining rate (like a 91% drop) highlights inefficiencies in the funnel.
- Data-Driven Decisions: Users can use this metric to test and refine their funnel, such as A/B testing email content, adjusting timing in automations, or improving landing page design to boost conversions.
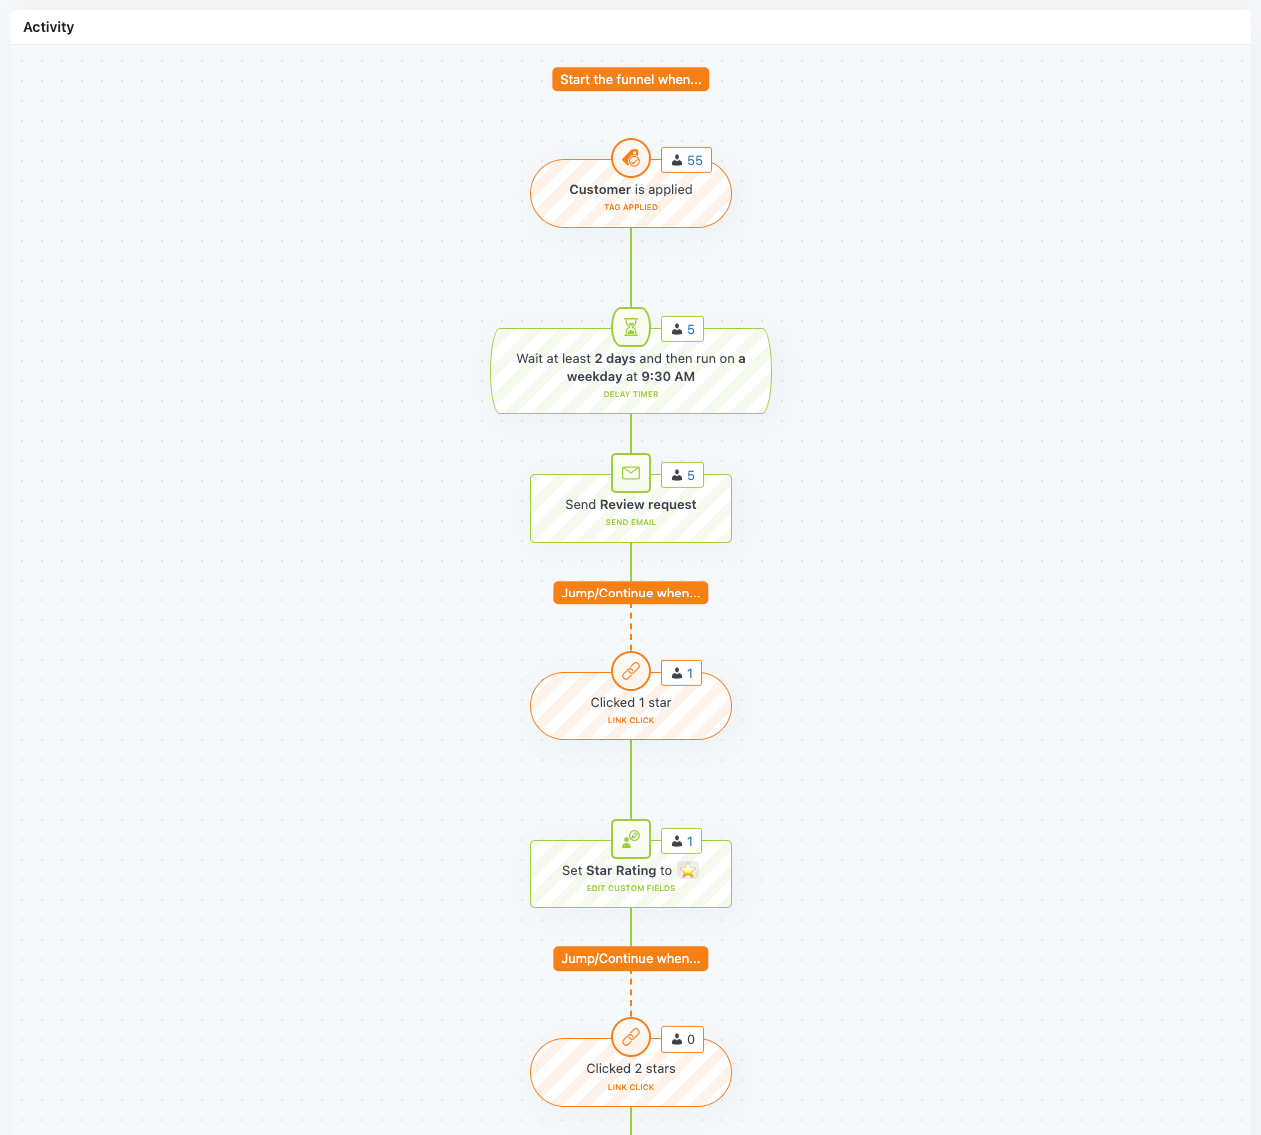
Funnel Breakdown
The Funnel Breakdown is a visual tool that displays the progression of contacts through a funnel. It shows the number of contacts at each step and the percentage of contacts who move from one step to the next, helping identify where contacts are engaging or dropping off.
 Quick Email Stats
 Quick Email Stats
These stats provide a concise overview of email campaign effectiveness within a specific funnel or broadcast. It includes three primary metrics: Emails Sent, Open Rate, and Click Thru Rate, each with a comparison to the previous 7 days to highlight trends and changes in performance.
 Emails Sent

- Definition: This metric shows the total number of emails sent as part of the funnel or campaign during the reporting period.
- Example Data: 5 emails sent, with a 29% decrease compared to the previous 7 days.
- Campaign Activity Monitoring: Groundhogg users can track the volume of emails being sent, which reflects the activity level of their funnel or broadcast. A decrease of 29% might indicate fewer contacts entering the funnel, a smaller broadcast list, or a change in automation settings.
- Resource Allocation: Understanding email volume helps users ensure they’re not overwhelming their audience with too many emails or missing opportunities by sending too few. They can adjust their funnel or broadcast settings in Groundhogg to align with their marketing goals.
Open Rate
- Definition: This metric represents the percentage of sent emails that were opened by recipients (Number of Opens ÷ Emails Sent × 100).
- Example Data: 40% open rate, with a 186% increase compared to the previous 7 days.
- Engagement Insight: A 40% open rate is relatively high for email marketing (industry averages often range from 15-25%), and the 186% increase indicates a significant improvement in engagement. Groundhogg users can see that their email subject lines, sender name, or timing are resonating well with their audience.
- Optimization Opportunities: The sharp increase in open rate suggests that recent changes (e.g., better subject lines, improved deliverability, or more relevant content) are working. Users can analyze what drove this improvement and apply those strategies to other campaigns, using Groundhogg’s A/B testing features to further refine their approach.
Click Thru Rate (CTR)
- Definition: This metric calculates the percentage of recipients who clicked on a link within the email (Number of Clicks ÷ Emails Sent × 100).
- Example Data: 0% click-thru rate, with no change (0%) compared to the previous 7 days.
- Action Tracking: A 0% click-thru rate indicates that none of the recipients who received the email clicked on any links, which is a critical issue for a funnel designed to drive actions (e.g., providing feedback, as seen in the related funnel breakdown). Groundhogg users can use this metric to identify a lack of engagement with the email content or calls-to-action.
- Content Improvement: The lack of clicks prompts users to review and optimize their email content. They can use Groundhogg’s email editor to improve the design, make calls-to-action more prominent, or add incentives (e.g., a discount for providing feedback) to encourage clicks.
Email Performance
 Emails

- Definition: This column lists the name of the email within the funnel or broadcast.
- Example Data: "Review request"
- Email Identification: Groundhogg users can quickly identify which email in their funnel or broadcast is being analyzed. In this case, the "Review request" email is likely the initial email sent to customers asking them to rate their experience (as part of the feedback funnel seen in the Funnel Breakdown).
- Contextual Analysis: Knowing the email’s purpose (requesting a review) helps users contextualize the performance metrics and make targeted improvements to that specific email.
Sent
- Definition: This column shows the total number of emails sent to contacts as part of the funnel or broadcast.
- Example Data: 5 emails sent
- Campaign Reach: Groundhogg users can see how many contacts received the email, which reflects the reach of their campaign. In this case, only 5 emails were sent, which aligns with the low volume seen in the related Email Performance Report.
- Funnel Entry Monitoring: A low number of emails sent (5) might indicate that few contacts are entering the funnel (e.g., being tagged as customers). Users can use this insight to adjust the funnel’s entry conditions or grow their contact list to increase reach.
Opens
- Definition: This column displays the percentage of sent emails that were opened by recipients, along with the raw number of opens in parentheses (Number of Opens ÷ Emails Sent × 100).
- Example Data: 40% open rate (2 opens)
- Engagement Tracking: A 40% open rate is strong (industry averages typically range from 15-25%), indicating that the email’s subject line, sender name, or timing is effective. The raw number (2 opens) confirms that 2 out of the 5 recipients opened the email.
- Optimization Focus: The high open rate suggests that the email is reaching the right audience and capturing attention. Groundhogg users can analyze what contributed to this success (e.g., a compelling subject line) and apply those learnings to other emails, using Groundhogg’s A/B testing features to further improve open rates.
Clicks
- Definition: This column shows the percentage of sent emails that resulted in a click on a link within the email, along with the raw number of clicks in parentheses (Number of Clicks ÷ Emails Sent × 100).
- Example Data: 0% click rate (0 clicks)
- Action Tracking: A 0% click rate indicates that none of the recipients clicked on any links in the email, which is a critical issue for a "Review request" email designed to drive clicks on star-rating links (as seen in the Funnel Breakdown). Groundhogg users can use this metric to identify a lack of engagement with the email’s content or calls-to-action.
- Content Improvement: The lack of clicks prompts users to review and optimize the email body. They can use Groundhogg’s email editor to make calls-to-action more prominent, ensure links are working, or add incentives (e.g., a discount for providing feedback) to encourage clicks.
Unsubs (Unsubscribes)
- Definition: This column displays the percentage of recipients who unsubscribed after receiving the email, along with the raw number of unsubscribes in parentheses (Number of Unsubscribes ÷ Emails Sent × 100).
- Example Data: 0% unsubscribe rate (0 unsubscribed)
- Audience Retention Insight: A 0% unsubscribe rate is a positive sign, indicating that the email content isn’t causing recipients to opt out. Groundhogg users can be confident that the email isn’t alienating their audience.
- Content Validation: The lack of unsubscribes suggests that the email’s tone, frequency, and relevance are acceptable to recipients. Users can continue using a similar approach in future emails while focusing on improving the click rate.
Forms
The Forms table provides a detailed breakdown of performance metrics for forms used within a funnel. It includes columns for Name, Views, Impressions, and Submissions, allowing users to evaluate how effectively their forms are capturing data or driving actions.
 Name
Name
 Name
Name- Definition: This column lists the names of the forms being tracked within the funnel.
- Example Data: "Positive Review Feedback" and "Negative Review Feedback"
- Form Identification: Groundhogg users can quickly identify which forms are being analyzed. In this case, the forms are designed to collect detailed feedback after a customer provides a star rating (e.g., "Positive Review Feedback" for 4-5 star ratings, "Negative Review Feedback" for 1-2 star ratings, as seen in the Funnel Breakdown).
- Contextual Analysis: Knowing the purpose of each form helps users contextualize the performance metrics and make targeted improvements. For example, these forms are likely intended to gather detailed reviews after a customer rates their experience, which can be used to improve customer satisfaction or collect testimonials.
Views
- Definition: This column shows the number of times the form was viewed by visitors, meaning the form was loaded on a page and seen by a contact.
- Example Data: 0 views for both "Positive Review Feedback" and "Negative Review Feedback"
- Visibility Tracking: A view count of 0 indicates that no contacts have seen either form, which aligns with the Funnel Breakdown showing that no contacts reached the "Positive Review Feedback" or "Negative Review Feedback" steps. Groundhogg users can use this metric to identify issues with form visibility or funnel progression.
- Funnel Flow Analysis: The lack of views suggests that contacts aren’t reaching the form step in the funnel, prompting users to investigate earlier steps (e.g., the "Review request" email’s 0% click rate, as seen in the Email Performance Table) to ensure contacts are being directed to the form.
Impressions
- Definition: This column displays the number of times the form was displayed to a visitor, which may differ from views if the form is embedded in a page that requires scrolling or interaction to become visible.
- Example Data: 0 impressions for both forms
- Engagement Opportunity Insight: An impression count of 0 confirms that the forms haven’t been displayed to any contacts, reinforcing the issue of contacts not reaching this step in the funnel. Groundhogg users can use this metric to assess whether the form’s placement or trigger conditions are preventing it from being shown.
- Form Placement Optimization: The lack of impressions prompts users to check the form’s setup, such as ensuring it’s properly embedded on a landing page, triggered by a specific action (e.g., clicking a star rating), or not hidden by display conditions.
Submissions
- Definition: This column shows the number of times the form was successfully submitted by a contact, indicating a completed action (e.g., providing feedback).
- Example Data: 0 submissions for both forms (indicated by a dash, which typically means no submissions)
- Conversion Tracking: A submission count of 0 means no contacts have completed the form, which is expected given the 0 views and impressions. Groundhogg users can use this metric to confirm that the funnel isn’t achieving its goal of collecting feedback.
- Actionable Improvements: The lack of submissions highlights a critical issue in the funnel’s flow. Users can focus on driving traffic to the form by improving earlier steps (e.g., increasing the click rate on the "Review request" email) or simplifying the form itself to encourage submissions once contacts reach it.
Activity